
Dashboard
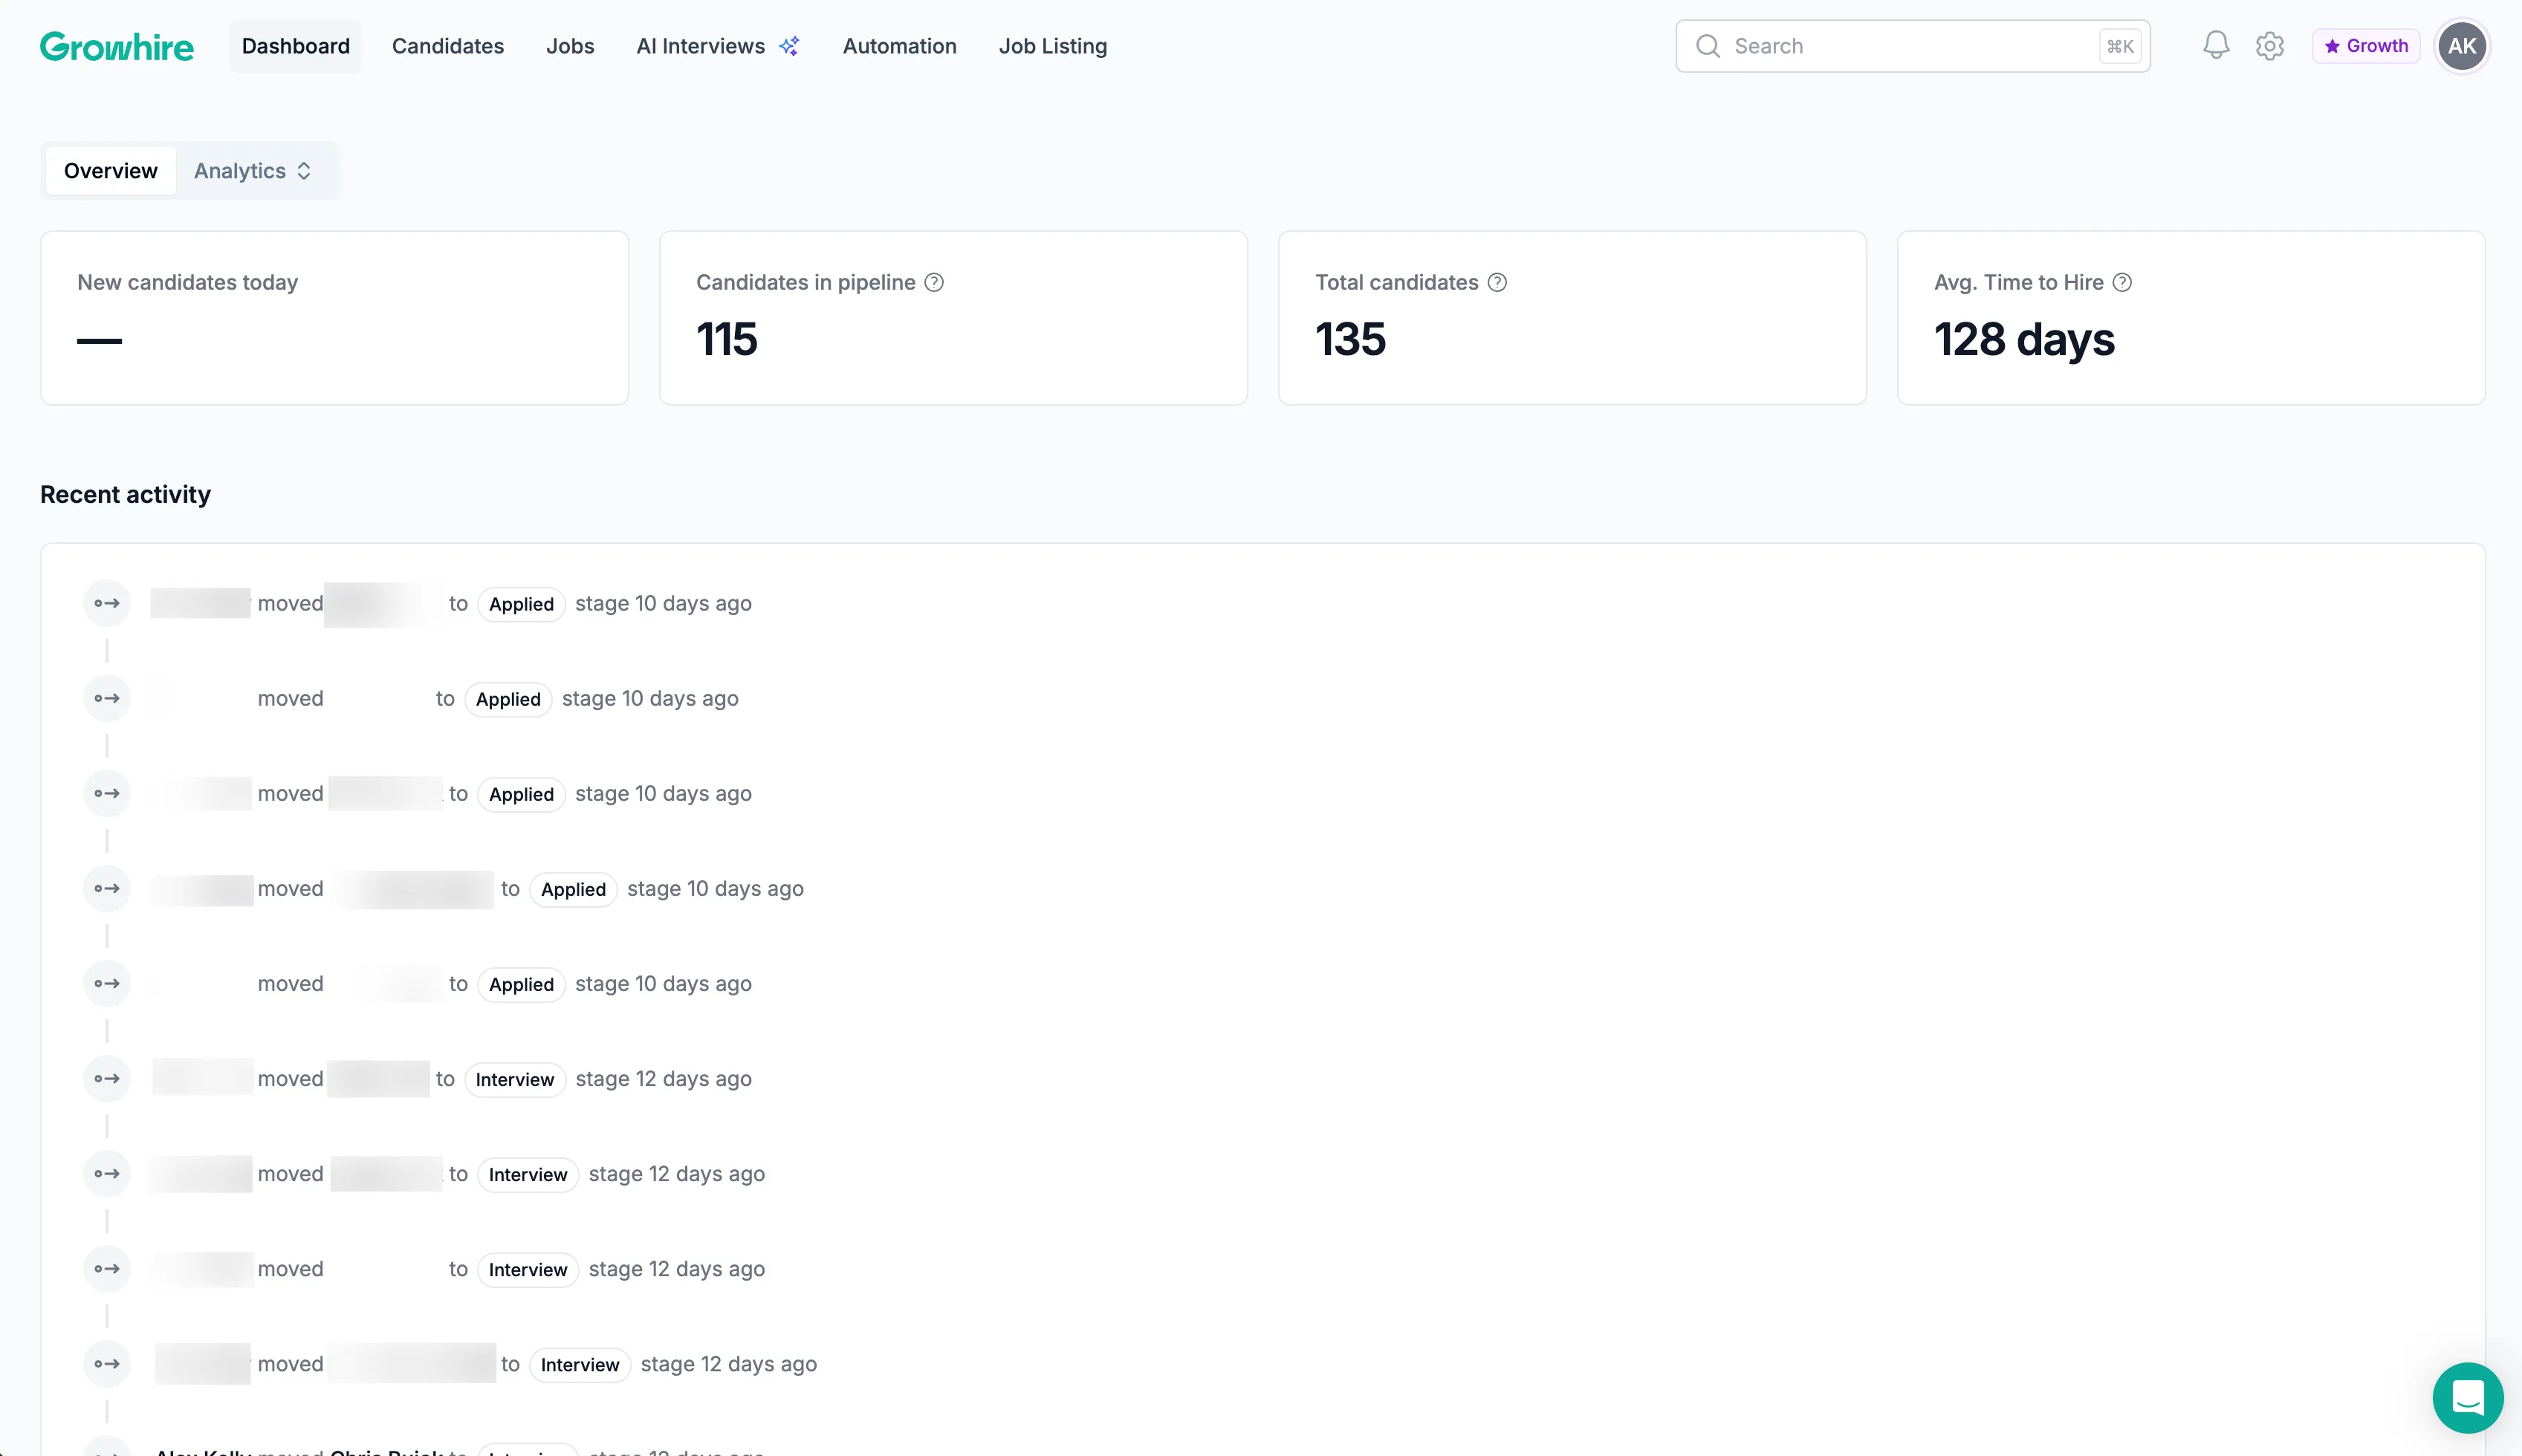
At a glance, the dashboard gives you real-time insight into your account activity across admins and analytics data.
Select Overview to see how many new candidates applied today, the number of candidates currently in your pipeline, your total candidate volume, your average time to hire, and recent admin activity.
Viewing Job-Specific Analytics
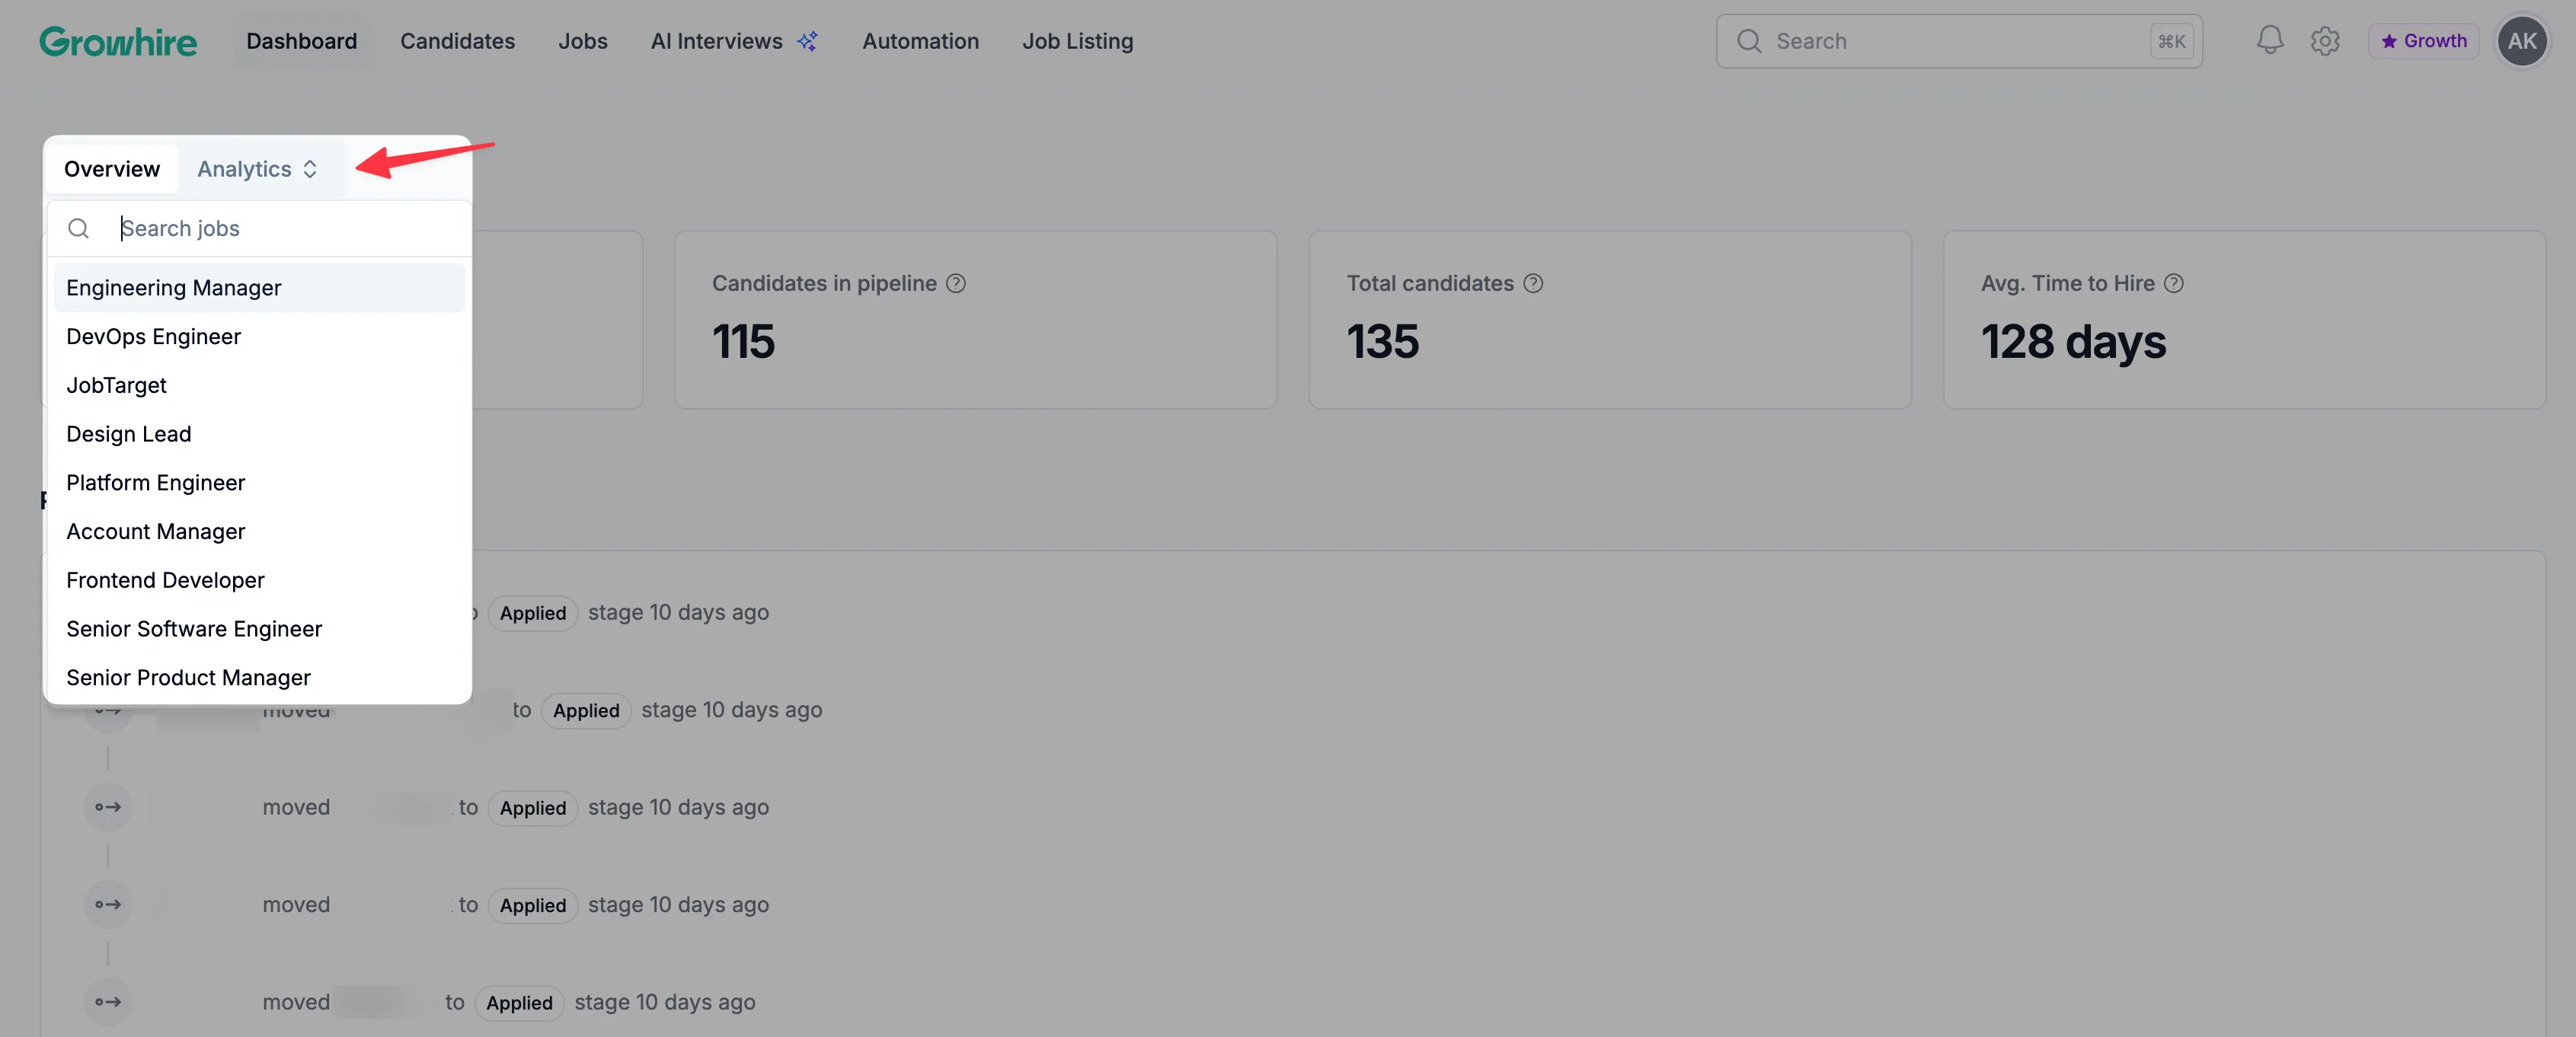
Section titled “Viewing Job-Specific Analytics”From the Dashboard, toggle to the Analytics view, and then select a job from the dropdown menu to review role-specific data.
Once a job is selected, the page will display the same high-level metrics shown on the main dashboard — including new candidates applied today, the number of candidates currently in the pipeline, total candidate volume, and average time to hire — now filtered for that specific role.
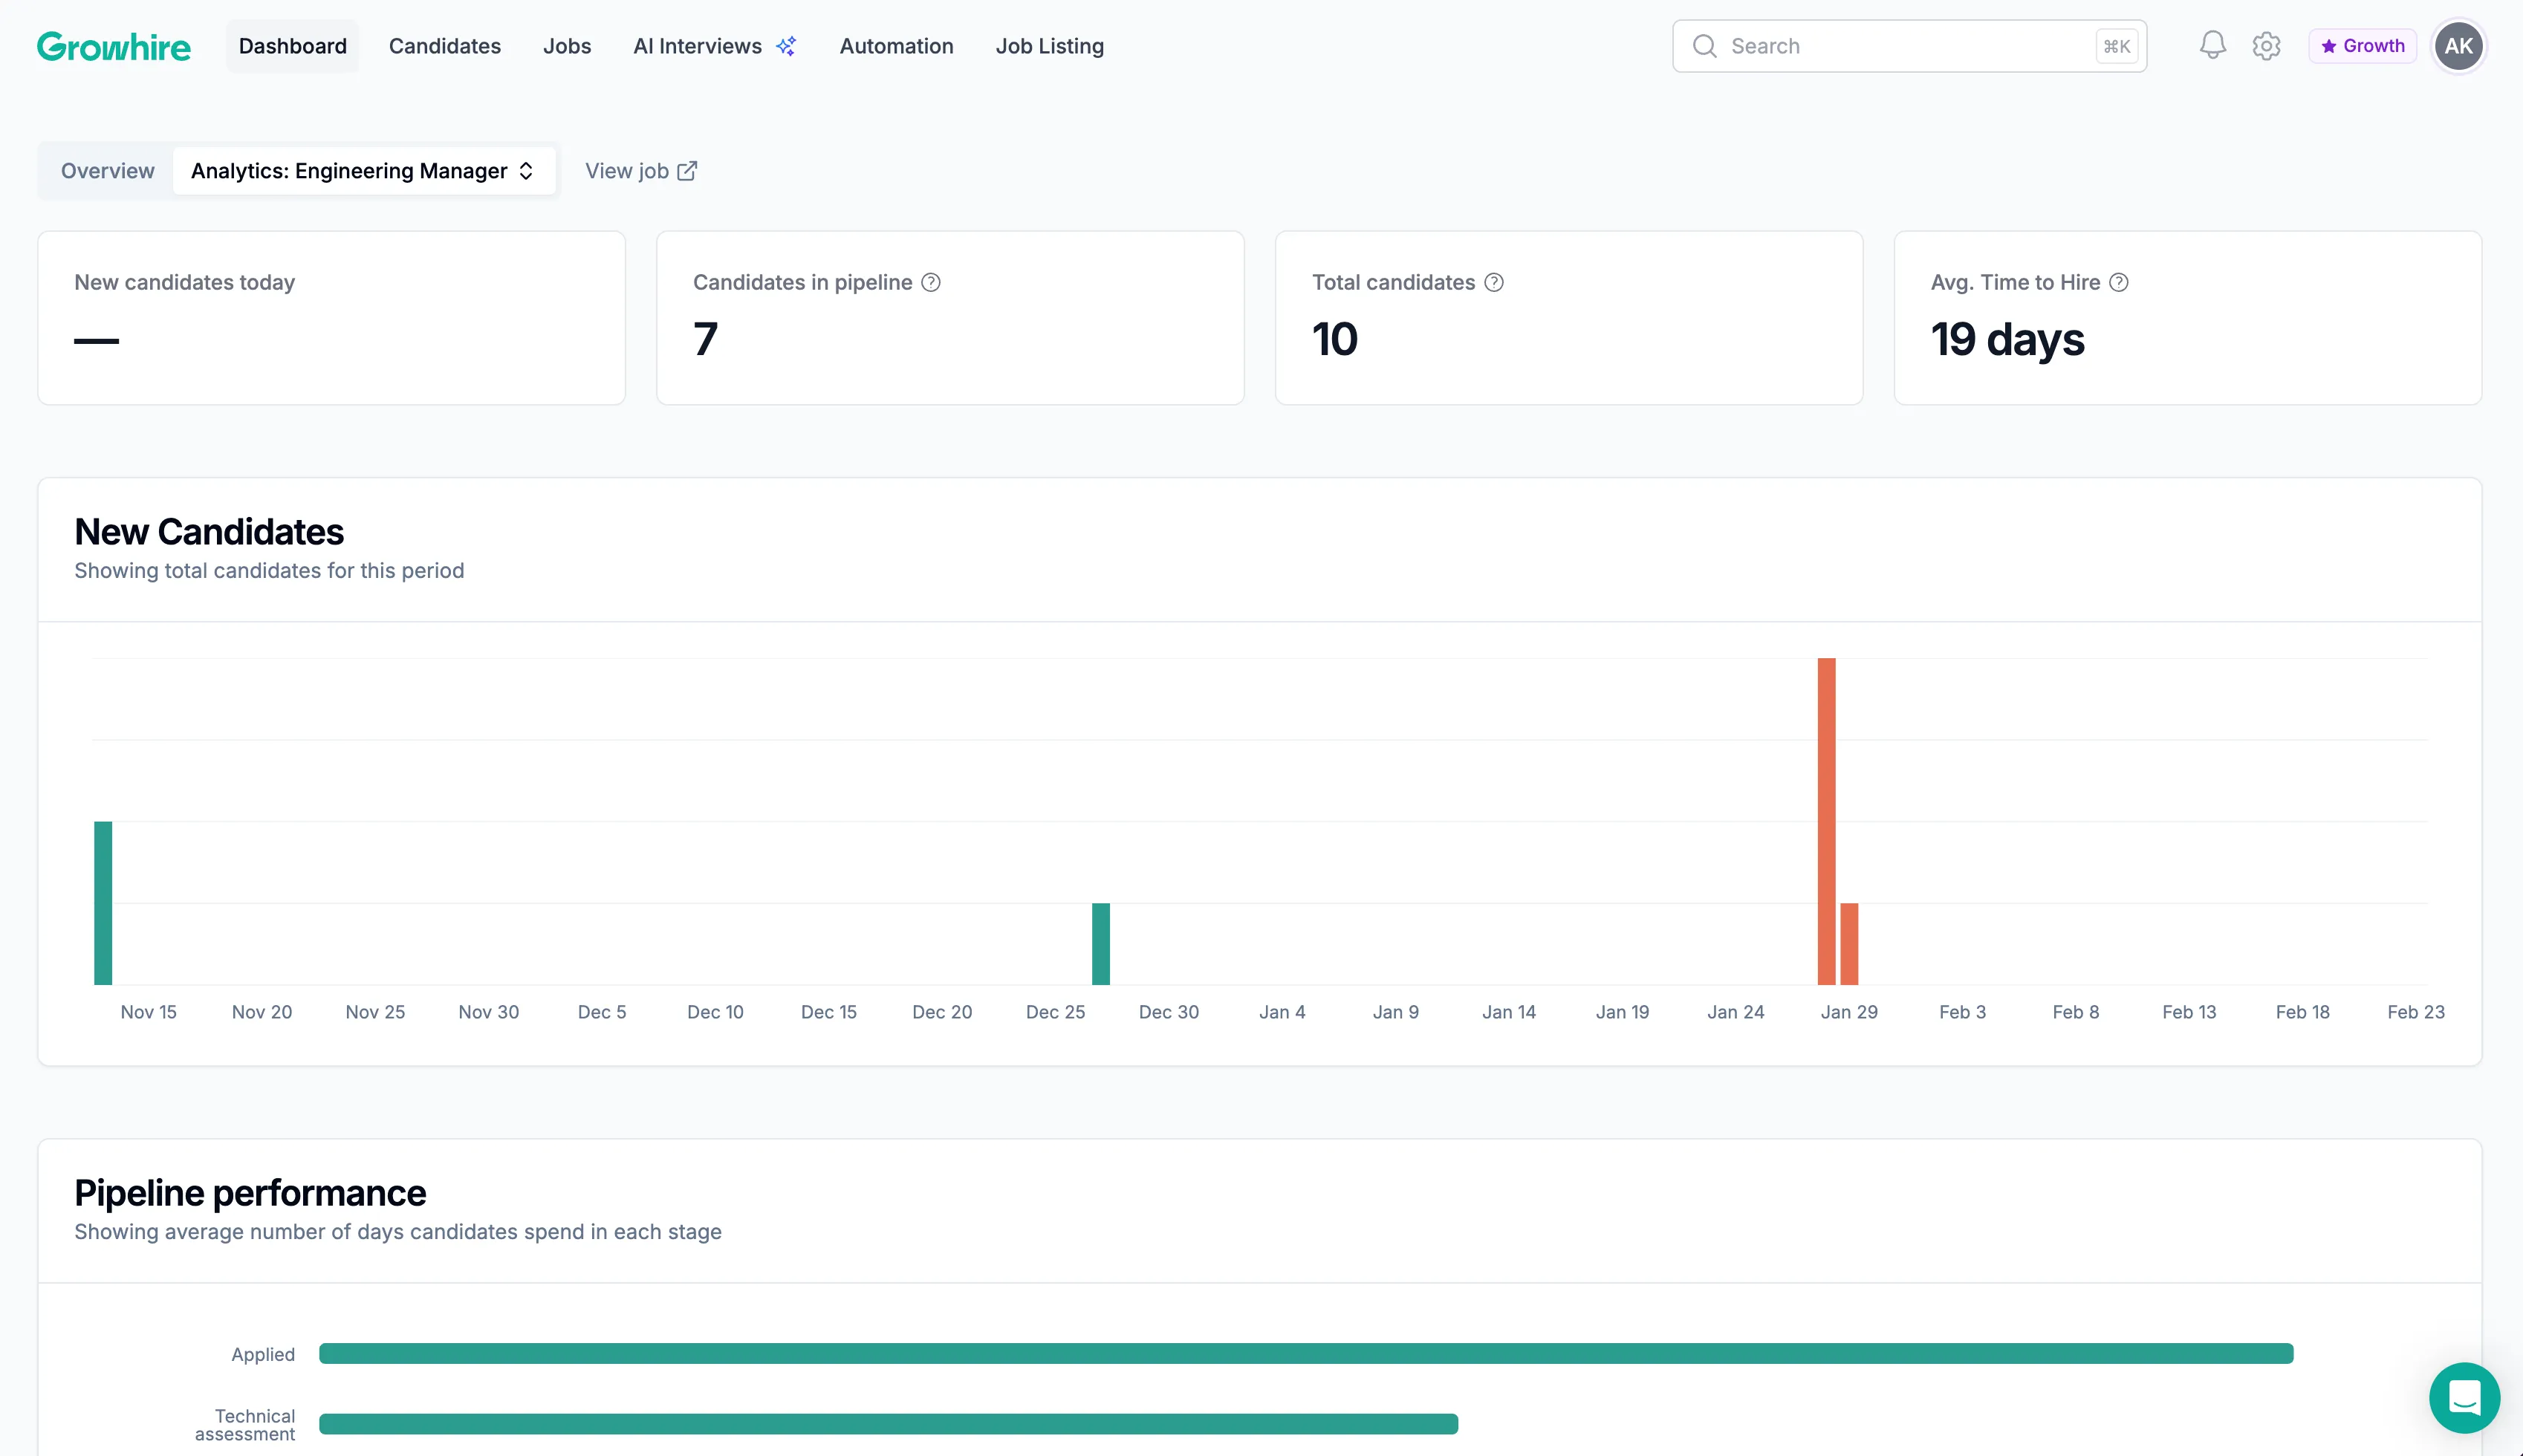
Below these metrics, you’ll find visual reports to help you analyze performance in more detail:
- New Candidates: A bar graph showing candidate application trends over time.
- Pipeline Performance: Displays the average number of days candidates spend in each stage of the hiring process.
- Pipeline Conversation: Highlights the conversion rate of candidates as they move through each stage of the pipeline.
- Pipeline Overview: Provides a snapshot of candidates in each stage of the pipeline, calculated at the end of each day.